Hey, your GB Studio game looks pretty cool, you programmed a system that relies on complex events and variables, and you don’t seem to have made a mistake! It should work fine, right? Whoops, it didn’t, and now you don’t know what to do. Thankfully, there are ways to see what you did wrong, so that you can fix it. It’s called debugging, and it’s an important part of game development.
Debugging is the art of checking if everything is in order to make sure the player doesn’t encounter a bug that results in something unexpected. In the best case scenario this could create a minor inconvenience for the player, but in the worst case this could be game breaking. GB Studio doesn’t come with debugging tools like most other programming software, so you’ll have to get creative when it comes time to debugging your game.
The Debug Menu
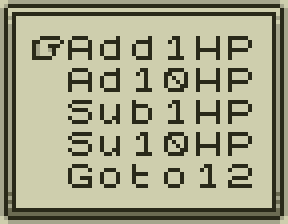
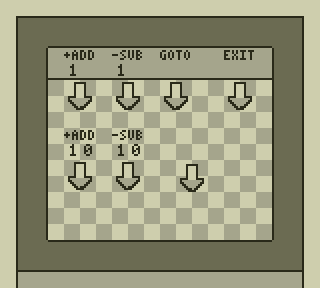
A Debug Menu is a common practice for game developers. Its purpose is to provide an easy way for you to manipulate parts of your game within the game itself, and you can customize it however you want to fit your needs. It can send you to a scene to test something you just added, manipulate variables, and more. It’s very useful, and you can hide so that only you and your development team know where it is. If you don’t want your debug menu accessible by players, simply remove it from the final build of the game.
Checking Variables
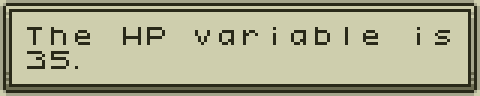
If you’re manipulating variables and using comparison events, you might need to check if the result of a variable is not computing as expected. The best known way to do this is by printing it on a dialogue box. Simply use a [Text: Display Dialogue] event and type the code for the variable. This works with both Global Variables ($xx$) and Local Variables (#xx#). It helps to add a bit of context, like in the image above. This can also help by adding it multiple times in a script to make sure each step is working correctly.
Unfortunately, as far as I know the dialogue method is the only way to display variables, you can’t view variables as they are being used elsewhere. It is possible to use an emulator like bgb with it’s debugging tools to examine memory values, but figuring out where they are allocated is beyond the scope of this article.
Double (and Triple) Checking Your Scripts
Okay, I know this might sound obvious, but here’s the thing – when you get far into the development process (or even sometimes early into it) you might be overconfident in how you scripted something. The previous ways to debug work well, but they should be used to confirm functionality. Maybe you did like me, and used an event that looks somewhat similar to another event you actually want to use. Finding your mistake manually is recommended if the script is simple, and double checking your work should always be your first step in debugging.
Debugging is a vital part of the development process and it can not only lead developers to fixing issues, but also adding entirely new features based on previous observations. If you haven’t done so, bank on adding some debug time to your workflow.

a/k/a “Anima” – Game Developer Wannabe, Average Internet Enjoyer, Human Being. (he/him)